对文章的搬运
数学建模国赛A题第一问的粗糙解决方案.
对文章的搬运
matlab作图
此文章只介绍24年国赛A题的第一问
因为问题二没有时间写了,先给出第一问的粗糙解法。
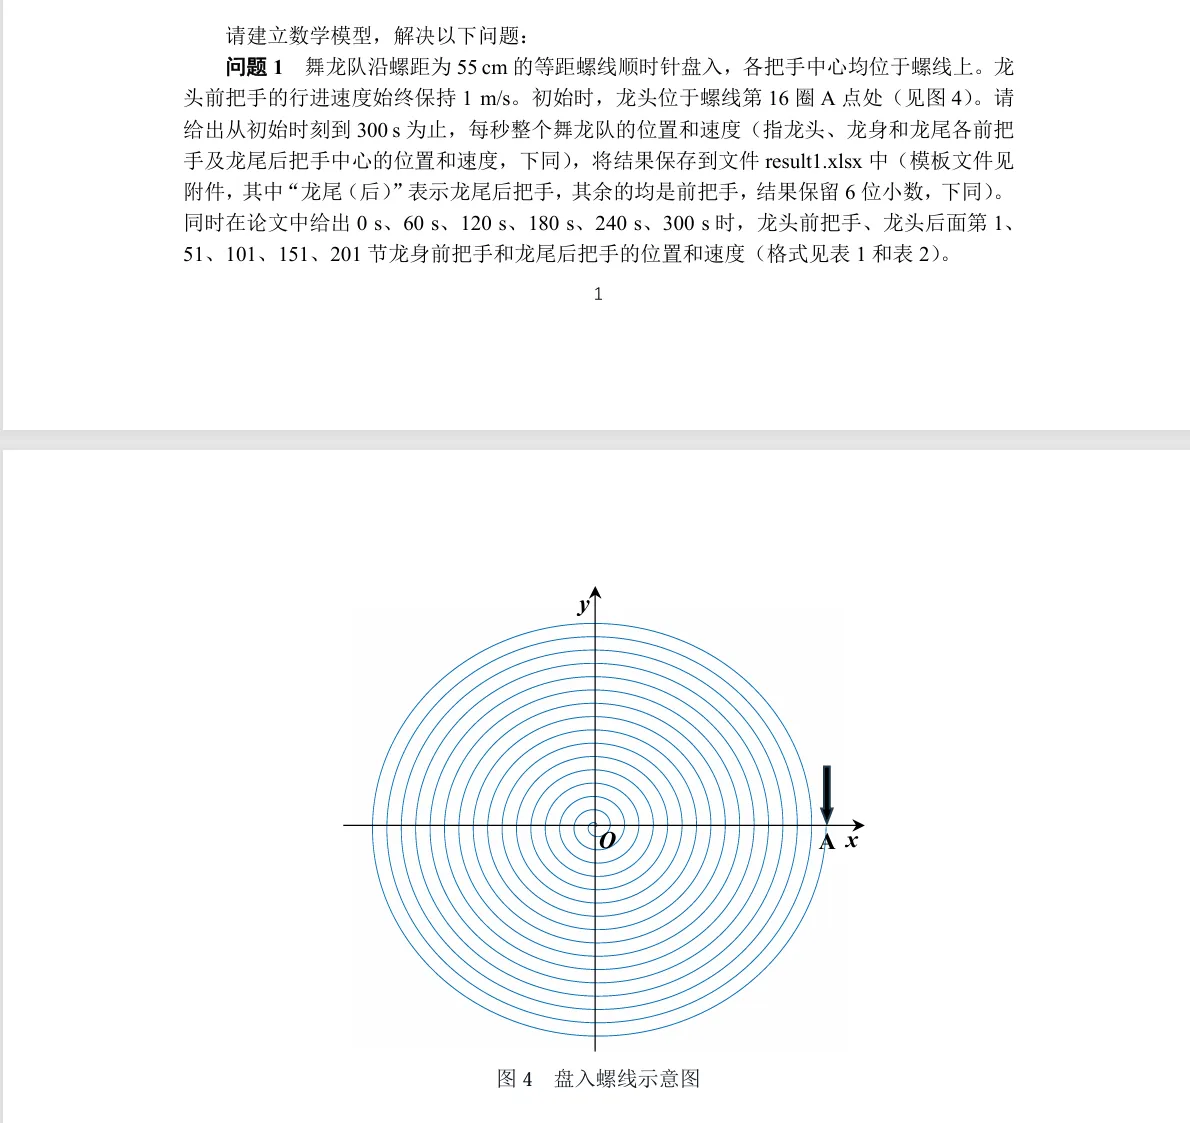
阿基米德螺旋线方程: $ r = b \theta① $
自定义: $ k = \frac{b}{2\pi}② $
曲线积分: $ dS = \sqrt{(dr)^2 + (r \, d\theta)^2}③ $
已知条件: $ \frac{dS}{dt} = 1④ $
由上式得到: $ \frac{d\theta}{dt} = -\frac{1}{k \sqrt{\theta^2 + 1}} $
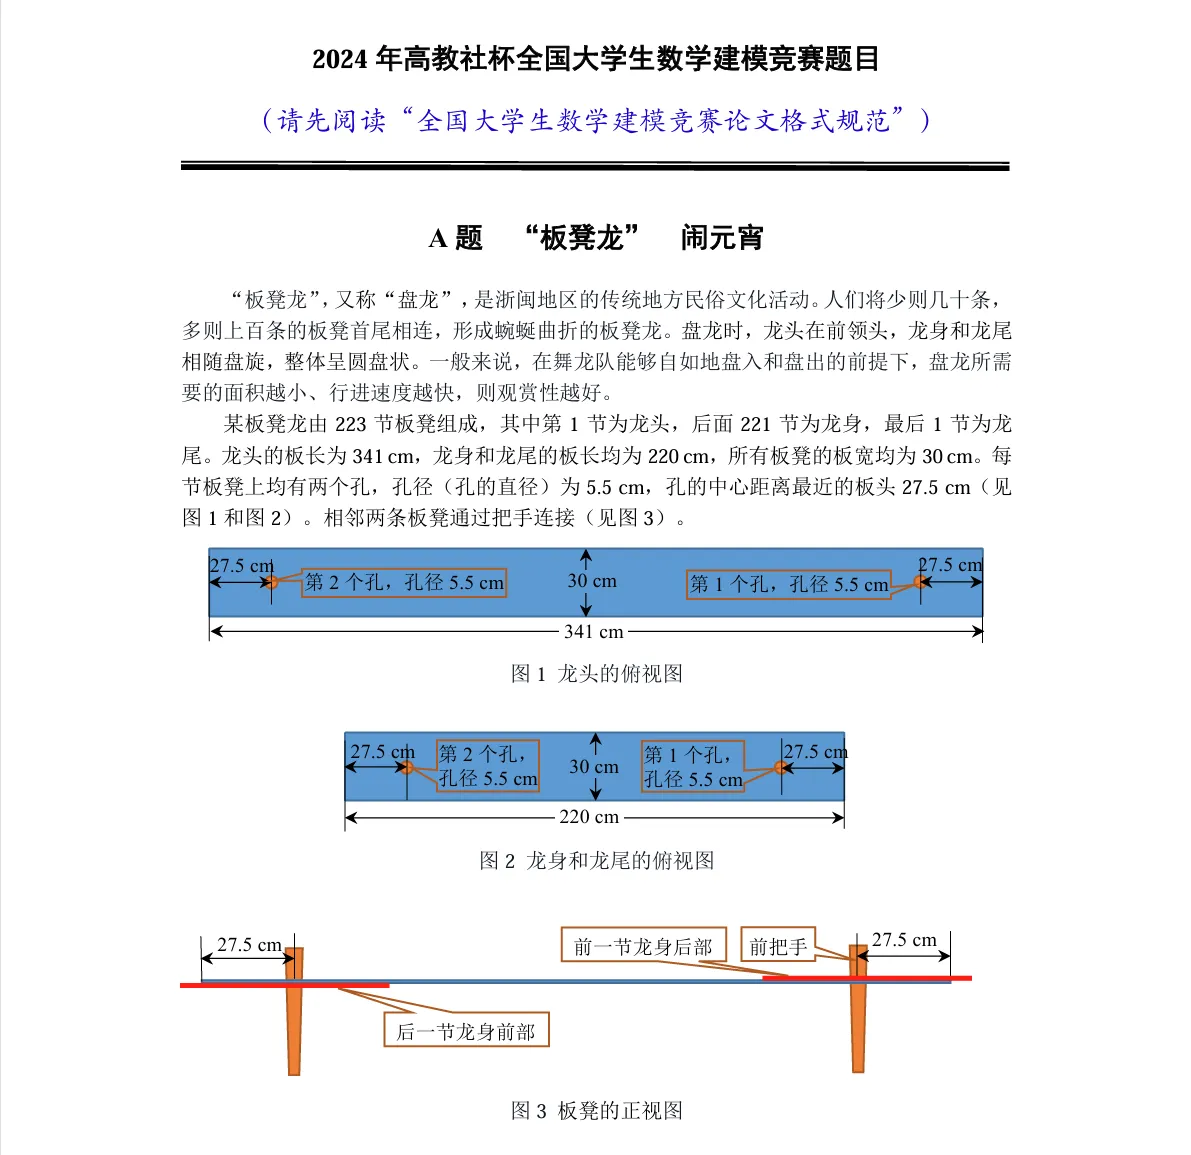
其中$b$为已知螺距0.55m,$S$为路径长。这样可以得到第一个龙把手角度随时间的变化,进而可以得到第一个龙把手坐标随时间的变化; 下面算后面222个(好像是222个龙把手)的坐标变化:
由于懒打公式,直接贴论文部分:
解决:第一问想到解法很简单,主要难点就是编程部分。 下面分别利用MATLAB和Python独立求解第一问:


ps:不同软件的求解结果可能存在偏差,读者可思考下面Python代码有何问题,为什么与MATLAB求解的答案不一致
MATLAB:
第一步:求解轨迹和第一个龙把手
1
2
3
4
5
6
7
8
9
10
11
12
13
14
15
16
17
18
19
20
21
22
23
24
25
26
27
28
29
30
31
32
33
34
35
36
37
38
39
40
41
42
43
44
45
46
47
48
49
50
51
52
53
54
55
56
57
58
59
60
61
62
63
64
65
66
67
68
69
70
71
72
73
74
75
76
77
78
79
80
81
82
83
84
85
86
clear all;
%绘制轨迹图
k=0.55/(2*pi);
theat=linspace(32*pi,0);
r=k*theat;
x=r.*cos(theat);
y=r.*sin(theat);
plot(x,y)
grid on;
% 设置坐标轴比例相等
axis equal;
%%%%上述图像没设置指定步长,单纯有点好看

%1.
% 绘制轨迹图
k = 0.55 / (2 * pi); % 常数 k
theta = linspace(32 * pi, 0, 1000); % 生成 theta 的值
r = k * theta; % 计算半径 r
x = r .* cos(theta); % 计算 x 坐标
y = r .* sin(theta); % 计算 y 坐标

% 绘制轨迹
figure;
plot(x, y, 'LineWidth', 1, 'Color', [1, 0.5, 0.5]); % 使用浅红色线条
xlabel('X/m', 'FontSize', 14, 'FontWeight', 'bold'); % X 轴标签
ylabel('Y/m', 'FontSize', 14, 'FontWeight', 'bold'); % Y 轴标签
title('把手轨迹图', 'FontSize', 16, 'FontWeight', 'bold'); % 图形标题
xticks(linspace(-8.8, 8.8, 5)); % 从 -8.8 到 8.8,生成 5 个刻度
ylim([-9, 9])
grid on; % 添加网格
axis equal; % 设置坐标轴比例相等
set(gca, 'FontSize', 12, 'FontWeight', 'bold'); % 设置坐标轴字体
%set(gcf, 'Color', 'w'); % 设置图形背景为白色

hold on; % 保持当前图形,以便在其上绘制箭头

% 定义箭头长度
arrowLength = 1.25; % 根据需要调整这个值

n = 30; % 总点数
for i = 1:n
    % 选择非等间距的点,确保最开始的点比后面的点多
    idx = round(linspace(1, length(x), n));
    % 计算箭头的方向
    dx = -arrowLength * (-sin(theta(idx))); % x方向的增量
    dy = -arrowLength * cos(theta(idx)); % y方向的增量
    % 绘制箭头
    quiver(x(idx), y(idx), dx, dy, 'b', 'LineWidth', 1, 'AutoScale', 'off');%'AutoScale', 'off' 参数确保箭头的长度不会根据图的尺寸自动缩放。
end

hold off; % 释放图形
% 保存图形为高质量图像
print('轨迹图', '-dpng', '-r1000'); % 保存为 PNG 格式,分辨率为 300 dpi

%2.
%求解龙头前把手的极角变化
k = 0.55/(2*pi);
theta0 = 32 * pi; % 初始条件
% 定义微分方程
ode = @(t, theta) -1/(k * sqrt(theta^2 + 1));

% 求解微分方程
[t, theta] = ode45(ode, [0, 600], theta0);

% 绘制结果
figure;
plot(t, theta, 'b', 'LineWidth', 2); % 红色线条,宽度为 2
xlim([0, 460]);
ylim([0, 32*pi+1]);
xlabel('时间 t', 'FontSize', 14, 'FontWeight', 'bold');
ylabel('\theta(t)', 'FontSize', 14, 'FontWeight', 'bold');
title('龙头前把手\theta(t)随时间变化', 'FontSize', 16, 'FontWeight', 'bold');
grid on;

% 简单美化图形
set(gca, 'FontSize', 12, 'FontWeight', 'bold'); % 设置坐标轴字体
set(gca, 'Box', 'on'); % 显示边框
%ax = gca;
%ax.XColor = 'k'; % 设置 x 轴颜色
%ax.YColor = 'k'; % 设置 y 轴颜色

% 添加图例
legend('θ(t)', 'Location', 'northeast', 'FontSize', 12);

% 保存图形为高质量图像
print('龙头前把手\theta(t)随时间变化', '-dpng', '-r1000'); % 保存为 PNG 格式,分辨率为 1000 dpi
问题二:求解各个把手的情况
1
2
3
4
5
6
7
8
9
10
11
12
13
14
15
16
17
18
19
20
21
22
23
24
25
26
27
28
29
30
31
32
33
34
35
36
37
38
39
40
41
42
43
44
45
46
47
48
49
50
51
52
53
54
55
56
57
58
59
60
61
62
63
64
65
66
67
68
69
70
71
72
73
74
75
76
77
78
79
80
81
82
83
84
85
86
87
88
89
90
91
92
93
94
95
96
97
98
99
100
101
102
103
104
105
106
107
108
109
110
111
112
113
114
115
116
117
118
119
120
121
122
123
124
125
126
127
128
129
130
131
132
133
134
135
136
137
138
139
140
141
142
143
144
145
146
147
148
149
150
151
152
153
154
155
156
157
158
159
160
161
162
163
164
165
166
167
168
169
170
171
172
173
174
175
176
177
178
179
180
181
182
183
184
185
186
187
188
189
190
%龙头各个把手的情况
clear all;
%求解龙头前把手的极角变化
k = 0.55/(2*pi);
theta0 = 32 * pi; % 初始条件

% 定义微分方程
ode = @(t, theta) -1./(k * sqrt(theta^2 + 1));

% 定义时间范围
tspan = 0: 1:300; % 根据需要调整时间范围

% 使用 ode45 求解微分方程
[t, theta] = ode45(ode, tspan, theta0);

r=k*theta;
X1=r.*cos(theta);
Y1=r.*sin(theta);
X=nan*zeros(224,length(X1));
Y=nan*zeros(224,length(X1)); % 每一行代表每个凳子的前把手孔的位置在各个时间点处的值,因为尾部还有一个孔,所以一共223+1个,所以X和Y对应223+1行
Theta=nan*zeros(224,length(X1));

X(1,:)=X1;%(i,j)中i表示第i个把手,j表示第j个时刻
Y(1,:)=Y1;
Theta(1,:)=theta;

for j=1:length(t)
    % 特殊处理 i=2 的情况
    fun=@(theta)(k*theta.*cos(theta)-X(1,j)).^2+(k*theta.*sin(theta)-Y(1,j)).^2-2.86^2;
    options = optimoptions('fsolve','Display','off');
    theta=fsolve(fun,Theta(1,j),options);
    %while theta<=Theta(1,j) &&
    %abs(k*theta-k*Theta(1,j))>k*2*pi%此处主要担心求解的theta会在前一个把手前面,不过好像也没什么问题
        %q=q+0.01;
        %theta=fsolve(fun,theta+q,options);
    %end

    %%%%%%此处假设每个把手始终是按照螺旋线排列的,即就算还没到(8.8,0)的位置,其他把手也会排列好;如果想改变,应该加个后面的把手角度不应该超过初始角度theta0.
    Theta(2,j)=theta;
    X(2,j)=k*theta*cos(theta);
    Y(2,j)=k*theta*sin(theta);

    % 处理 i=3 到 224 的情况
    for i=3:224
        fun=@(theta)(k*theta.*cos(theta)-X(i-1,j)).^2+(k*theta.*sin(theta)-Y(i-1,j)).^2-1.65^2;
        theta=fsolve(fun,Theta(i-1,j),options);
        %while theta<=Theta(i-1,j) && abs(k*Theta(i-2,j)-k*Theta(i-1,j))>k*2*pi
         %   q=q+0.1;
          %  theta=fsolve(fun,theta+q,options);
       % end
        Theta(i,j)=theta;
        X(i,j)=k*theta*cos(theta);
        Y(i,j)=k*theta*sin(theta);
    end
end


%% 下面来可视化,盘入的动态图
theta = 16*2*pi:-0.01:0;
r = k * theta;
x = r .* cos(theta);
y = r .* sin(theta);

figure; % 创建新图形窗口
for j = 1:length(t)
    % 绘制圆形轨迹
    plot(x, y, '--b', 'LineWidth', 1.2); % 使用蓝色虚线
    hold on;


    % 绘制数据点
    plot(X(:, j), Y(:, j), 'k-', 'LineWidth', 1.6, ...
         'Marker', 'o', 'MarkerSize', 5, 'MarkerFaceColor', 'r'); % 红色标记
    % 设置坐标轴属性
    axis equal;
    grid on;
    xlabel('x/m', 'FontSize', 12);
    ylabel('y/m', 'FontSize', 12);
    xlim([-12, 12]);
    ylim([-12, 12]);
    % 添加标题
    title({['t = ', num2str(t(j), '%.2f'), ' s'], '盘入动态'}, 'FontSize', 14);
    % 添加图例
    legend('轨迹', '当前点', 'Location', 'best', 'FontSize', 10);
    % 添加背景颜色
    set(gca, 'Color', [0.9 0.9 0.9]); % 设置坐标轴背景为浅灰色
    % 更新图形
    drawnow;
    hold off; % 释放图形
end


% % 创建颜色和线型数组
% colors = ['b', 'g', 'r', 'c', 'm', 'y', 'k']; % 不同的颜色
% lineStyles = ['--', '-.', '-']; % 不同的线型
% for j = 1:length(t)
%     plot(x,y,"--");
%     axis equal;
%     grid on;
%     xlabel('x/m');
%     ylabel('y/m');
%     hold on;
%
%     % 选择颜色和线型
%     colorIndex = mod(j-1, length(colors)) + 1;
%     linestyleIndex = mod(j-1, length(lineStyles)) + 1;
%     color = colors(colorIndex);
%     linestyle = lineStyles(linestyleIndex);
%
%     plot(X(:,j), Y(:,j), [color linestyle], 'LineWidth', 1.2, 'Marker', 'o', 'MarkerSize', 6, 'MarkerFaceColor', color); % 绘制线和标记
%     title({['t=', num2str(t(j))], '盘入的轨迹'}); % 更新标题显示当前时间
%     pause(0.5); % 暂停0.05秒,以便观察动画效果
%     drawnow; % 立即绘制图形
%     hold off; % 释放图形
%     hold on;%保持会臃肿哦
% end

dt=1;
V=zeros(size(X)); % 每一行对应一个孔的速度在不同时间节点上的值
V(:,1)=-k*sqrt(1+Theta(:,1).^2).*(Theta(:,2)-Theta(:,1))/dt; % 第一个时间点,用前向差分求导数
V(:,end)=-k*sqrt(1+Theta(:,end).^2).*(Theta(:,end)-Theta(:,end-1))/dt; % 最后一个时间点,用后向差分求导数
V(:,2:end-1)=-k*sqrt(1+Theta(:,2:end-1).^2).*(Theta(:,3:end)-Theta(:,1:end-2))/(2*dt); % 中间的每一个时间点,用中心差分来求导数
V(:,2:end-1) = -k * sqrt(1 + Theta(:,2:end-1).^2) .* (Theta(:,3:end) - Theta(:,1:end-2)) / (2*dt);

figure; % 创建一个新的图形窗口
colors = hsv(224); % 使用 hsv 生成224种不同的颜色
hold on; % 在这里保持状态
% 绘制每条线并记录句柄
hLines = gobjects(224, 1); % 预分配句柄数组
for m = 1:224
    if m == 1
        % 为第一个把手绘制并添加图例
        hLines(m) = plot(t, V(m,:), 'Color', colors(m,:), 'LineWidth', 1, 'LineStyle', '-', 'DisplayName', '把手 1');
    else
        % 其他把手绘制,不添加图例
        hLines(m) = plot(t, V(m,:), 'Color', colors(m,:), 'LineWidth', 1, 'LineStyle', '-', 'HandleVisibility', 'off');
    end
end

% 显示图例并确保有边框
lgd = legend('show');
xlabel('t/s'); % 设置x轴的标签
ylabel('v/(m/s)'); % 设置y轴的标签
title('各个把手的速度'); % 设置图形的标题
box on; % 在图像周围添加边框
% 添加颜色映射条
colormap(colors); % 设置当前图形的颜色映射
colorbar; % 添加颜色条
clim([1 224]); % 设置颜色条的范围
hold off; % 关闭hold状态

%%%%%下列生成图像不那么鲜艳的图像
% figure; % 创建一个新的图形窗口
% colors = lines(224);
% hold on; % 在这里保持状态
% figure; % 创建一个新的图形窗口
% colors = lines(224);
% hold on; % 在这里保持状态
% for m = 1:224
%     if m == 1
%         % 为第一个把手绘制并添加图例
%         plot(t, V(m,:), 'Color', colors(m,:), 'LineWidth', 1, 'LineStyle', '-', 'DisplayName', '把手 1');
%     else
%         % 其他把手绘制,不添加图例
%         plot(t, V(m,:), 'Color', colors(m,:), 'LineWidth', 1, 'LineStyle', '-', 'HandleVisibility', 'off');
%     end
% end
% % 显示图例并确保有边框
% lgd = legend('show');
% xlabel('t/s'); % 设置x轴的标签
% ylabel('v/(m/s)'); % 设置y轴的标签
% title('各个把手的速度'); % 设置图形的标题
% box on; % 在图像周围添加边框
% hold off; % 关闭hold状态

step = 1/dt;
timeIndex = 1:step:length(t); % 找出特定的时间点来记录1到300秒,间隔一秒,符合要求
weizhiData = zeros(2*(224), length(timeIndex)); % 行数为 2×224(每个点的 x 和 y 坐标)
weizhiData(1:2:end, :) = round(X(:, timeIndex), 6); % 这是所有点的x坐标,从1开始,每次隔两个记录,保留六位小数
weizhiData(2:2:end, :) = round(Y(:, timeIndex), 6); % y坐标
suduData = round(V(:, timeIndex), 6); % 这些记录所有点的速度信息

% 写入文件
outputname = 'result12.xlsx'; % 选择题目要求的附件1
sheetIndex = 1;%sheet选择1
start = 'B2';
xlswrite(outputname, weizhiData, sheetIndex, start);
sheetIndex = 2; %sheet选择2
start = 'B2';
xlswrite(outputname, suduData, sheetIndex, start);
Python:
问题一:求解轨迹和第一个龙把手
1
2
3
4
5
6
7
8
9
10
11
12
13
14
15
16
17
18
19
20
21
22
23
24
25
26
27
28
29
30
31
32
33
34
35
36
37
38
39
40
41
42
43
44
45
46
47
48
49
50
51
52
53
54
55
56
57
58
59
60
61
62
63
64
65
66
67
68
69
70
71
72
73
74
75
76
77
78
import numpy as np
import matplotlib.pyplot as plt
from scipy.integrate import solve_ivp

# 设置中文字体
plt.rcParams['font.sans-serif'] = ['SimHei']  # 使用黑体
plt.rcParams['axes.unicode_minus'] = False  # 解决负号显示问题


# 1. 绘制轨迹图
k = 0.55 / (2 * np.pi)  # 常数 k
theta = np.linspace(32 * np.pi, 0, 1000)  # 生成 theta 的值(num设置小一点有点好看咋)
r = k * theta  # 计算半径 r
x = r * np.cos(theta)  # 计算 x 坐标
y = r * np.sin(theta)  # 计算 y 坐标

# 绘制轨迹
plt.figure(figsize=(10, 8))
plt.plot(x, y, linewidth=1, color=[1, 0.5, 0.5])  # 使用浅红色线条
plt.xlabel('X/m', fontsize=14, fontweight='bold')  # X 轴标签
plt.ylabel('Y/m', fontsize=14, fontweight='bold')  # Y 轴标签
plt.title('把手轨迹图', fontsize=16, fontweight='bold')  # 图形标题
plt.ylim([-9, 9])
plt.grid(True)  # 添加网格
plt.axis('equal')  # 设置坐标轴比例相等
plt.gca().tick_params(labelsize=12, width=2)  # 设置坐标轴字体
plt.xticks(np.linspace(-8.8, 8.8, 5),fontsize=20)  # 从 -8.8 到 8.8,生成 5 个刻度
plt.yticks(fontsize=20)
# 保持当前图形,以便在其上绘制箭头
arrow_length = 1.25  # 根据需要调整这个值
n = 30  # 总点数
idx = np.round(np.linspace(0, len(x) - 1, n)).astype(int)  # 选择非等间距的点

# 计算箭头的方向
dx = -arrow_length * (-np.sin(theta[idx]))  # x方向的增量
dy = -arrow_length * np.cos(theta[idx])  # y方向的增量

# 绘制箭头
plt.quiver(x[idx], y[idx], dx, dy, color='b', angles='xy', scale_units='xy', scale=1, linewidth=1)

# 保存图形为高质量图像
#plt.savefig('轨迹图.png', dpi=1000)  # 保存为 PNG 格式,分辨率为 1000 dpi
plt.show()

# 2. 求解龙头前把手的极角变化
theta0 = 32 * np.pi  # 初始条件

# 定义微分方程
def ode(t, theta):
    return -1 / (k * np.sqrt(theta**2 + 1))

# 求解微分方程
t_span = (0, 600)
t_eval = np.linspace(0, 600, 1000)
solution = solve_ivp(ode, t_span, [theta0], t_eval=t_eval)

# 绘制结果
plt.figure(figsize=(10, 8))
plt.plot(solution.t, solution.y[0], 'b', linewidth=2)  # 蓝色线条,宽度为 2
plt.xlim([0, 460])
plt.ylim([0, 32 * np.pi + 1])
plt.xlabel('时间 t', fontsize=14, fontweight='bold')
plt.ylabel(r'$\theta(t)$', fontsize=14, fontweight='bold')
plt.title('龙头前把手$\theta(t)$随时间变化', fontsize=16, fontweight='bold')
plt.grid(True)
# 设置坐标轴字体
plt.gca().tick_params(labelsize=12, width=2)  # 设置坐标轴字体
plt.gca().set_box_aspect(1)  # 显示边框
plt.xticks(fontsize=20)
plt.yticks(fontsize=20)

# 添加图例
plt.legend([r'$\theta(t)$'], loc='upper right', fontsize=12)  # 使用有效的位置参数

# 保存图形为高质量图像
#plt.savefig('龙头前把手theta(t)随时间变化.png', dpi=1000)  # 保存为 PNG 格式,分辨率为 1000 dpi
plt.show()
问题二:求解各个把手的情况
1
2
3
4
5
6
7
8
9
10
11
12
13
14
15
16
17
18
19
20
21
22
23
24
25
26
27
28
29
30
31
32
33
34
35
36
37
38
39
40
41
42
43
44
45
46
47
48
49
50
51
52
53
54
55
56
57
58
59
60
61
62
63
64
65
66
67
68
69
70
71
72
73
74
75
76
77
78
79
80
81
82
83
84
85
86
87
88
89
90
91
92
93
94
95
96
97
98
99
100
101
102
103
104
105
106
107
108
109
110
111
112
113
114
115
116
117
118
119
120
121
122
123
124
125
126
127
128
129
130
131
132
133
134
135
136
137
138
139
140
141
142
143
144
145
146
147
148
149
150
151
152
153
154
155
156
157
158
159
160
161
162
163
164
165
166
167
168
169
170
171
172
173
import numpy as np
from scipy.integrate import solve_ivp
from scipy.optimize import fsolve
import matplotlib.pyplot as plt
from matplotlib import cm
from matplotlib.animation import FuncAnimation
import openpyxl
import matplotlib

# 设置 Matplotlib 后端为 TkAgg
matplotlib.use('TkAgg')
plt.rcParams['font.sans-serif'] = ['SimHei']  # 替换为系统中支持中文的字体名称
plt.rcParams['axes.unicode_minus'] = False  # 解决负号显示问题

# Define constants
k = 0.55 / (2 * np.pi)
theta0 = 32 * np.pi

def ode(time, theta):
    return -1 / (k * np.sqrt(theta**2 + 1))


tspan = (0, 300)
t_eval = np.arange(0, 301, 1)

sol = solve_ivp(ode, tspan, [theta0], t_eval=t_eval)
t = sol.t
theta = sol.y[0]

r = k * theta
X1 = r * np.cos(theta)
Y1 = r * np.sin(theta)
X = np.full((224, len(X1)), np.nan)
Y = np.full((224, len(X1)), np.nan)
Theta = np.full((224, len(X1)), np.nan)

X[0, :] = X1
Y[0, :] = Y1
Theta[0, :] = theta

def fun(theta, k, x_prev, y_prev, d):
    return (k * theta * np.cos(theta) - x_prev)**2 + (k * theta * np.sin(theta) - y_prev)**2 - d**2

# Iterate over time steps
for j in range(len(t)):
    # Special case for i=2
    theta_init = Theta[0, j]
    param = 2.86
    theta = fsolve(fun, theta_init, args=(k, X[0, j], Y[0, j], param))[0]

    Theta[1, j] = theta
    X[1, j] = k * theta * np.cos(theta)
    Y[1, j] = k * theta * np.sin(theta)

    # Handle i=3 to 224

    for i in range(2, 224):

        theta_init = Theta[i - 1, j] + 0.0001
#        #加0.0001的原因是1.小的扰动可以帮助算法跳出可能的平坦区域或不稳定点,使得求解器更快地找到合适的解。2. 某些优化或求解算法对初始值非常敏感,稍微偏离可能导致更好的收敛行为。3.我试过不加就不对4.我菜
#       ##解非线性方程,fsolve基于 MIN PACK 库的 hybr 算法(变形的 Powell 方法),很常用;root算法更宽泛,通常用于需要特定的算法的情况
        param = 1.65
        theta = fsolve(fun, theta_init, args=(k, X[i - 1, j], Y[i - 1, j], param))[0]
        if theta > 32*np.pi:
            Theta[i, j] = np.nan
            X[i, j] = np.nan
            Y[i, j] = np.nan
            break

        Theta[i, j] = theta
        X[i, j] = k * theta * np.cos(theta)
        Y[i, j] = k * theta * np.sin(theta)

        # Check the distance between points
        # distance = np.sqrt((X[i, j] - X[i-1, j])**2 + (Y[i, j] - Y[i-1, j])**2)
        # print(f"Distance between points {i-1} and {i} at time {j}: {distance}")


# 可视化动态图
theta_range = np.arange(32 * np.pi, 0, -0.01)
r = k * theta_range
x_range = r * np.cos(theta_range)
y_range = r * np.sin(theta_range)
fig, ax = plt.subplots()
ax.set_xlim(-12, 12)
ax.set_ylim(-12, 12)
ax.set_aspect('equal')
ax.grid(True)
ax.set_xlabel('x/m', fontsize=12)
ax.set_ylabel('y/m', fontsize=12)
ax.set_facecolor([0.9, 0.9, 0.9])


line, = ax.plot([], [], '--b', linewidth=1.2)
points, = ax.plot([], [], '-ko', markersize=5, markerfacecolor='r')


def init():
    line.set_data([], [])
    points.set_data([], [])
    ax.set_title('初始状态', fontsize=14)  # 仅在初始化时设置
    return line, points


def update(frame):
    line.set_data(x_range, y_range)
    points.set_data(X[:, frame], Y[:, frame])
    ax.set_title(f't = {t[frame]:.2f} s\n盘入动态', fontsize=14)  # 避免在每一帧中更新标题
    return line, points

ani = FuncAnimation(fig, update, frames=range(len(t)), init_func=init, blit=False, repeat=False)

print("Animation created successfully")
plt.show()

# 计算速度
dt = 1
V = np.zeros_like(Theta)
# 第一个时间点,用前向差分求速度
V[:, 0] = -k * np.sqrt(1 + Theta[:, 0]**2) * (Theta[:, 1] - Theta[:, 0]) / dt
# 最后一个时间点,用后向差分求速度
V[:, -1] = -k * np.sqrt(1 + Theta[:, -1]**2) * (Theta[:, -1] - Theta[:, -2]) / dt
# 中间的每一个时间点,用中心差分来速度
V[:, 1:-1] = -k * np.sqrt(1 + Theta[:, 1:-1]**2) * (Theta[:, 2:] - Theta[:, :-2]) / (2 * dt)

print("V max:", np.max(V))
print("V min:", np.min(V))

# 绘制速度图
fig, ax = plt.subplots()
colors =cm.hsv(np.linspace(0, 1, 224))
for m in range(224):
    if m == 0:
        ax.plot(t, V[m, :], color=colors[m], linewidth=1, linestyle='-', label=f'把手 {m + 1}')
    else:
        ax.plot(t, V[m, :], color=colors[m], linewidth=1, linestyle='-')

ax.set_xlabel('t/s')
ax.set_ylabel('v/(m/s)')
ax.set_xlim(0, 300)
ax.set_ylim(0.91, 1.11)
ax.set_title('各个把手的速度')
ax.legend(loc='best')
ax.set_facecolor([0.9, 0.9, 0.9])

sm = plt.cm.ScalarMappable(cmap=cm.hsv)
sm.set_array([])
plt.colorbar(sm, ax=ax, orientation='vertical', label='把手编号')

plt.show()

# 写入 Excel 文件
outputname = 'result1.xlsx'
wb = openpyxl.Workbook()
ws1 = wb.active
ws1.title = '位置数据'
ws2 = wb.create_sheet('速度数据')

timeIndex = np.arange(0, len(t), dt)
weizhiData = np.zeros((2 * 224, len(timeIndex)))
weizhiData[0::2, :] = np.round(X[:, timeIndex], 6)
weizhiData[1::2, :] = np.round(Y[:, timeIndex], 6)
suduData = np.round(V[:, timeIndex], 6)

for i, row in enumerate(weizhiData):
    ws1.append([''] + list(row))

for i, row in enumerate(suduData):
    ws2.append([''] + list(row))

wb.save(outputname)
This post is licensed under
CC BY 4.0
by the author.